
FBS Screening
The European Collection of Authenticated Cell Cultures (ECACC) currently offers several thousand cell lines to researchers. The majority of these require serum for growth, which presents the problem of deciding on a suitable supply. Many laboratories batch test sera by setting up multiple cultures, and then performing cell counts at fixed time points. This is both time consuming and requires at least duplicate counts at every time point to provide sufficient accuracy. At ECACC we have developed an automated method using an IncuCyte live cells analysis system. This not only produces a continuous growth curve, but can also show subtle differences in a serum’s ability to support growth for any chosen cell line that attaches to a cell culture vessel.
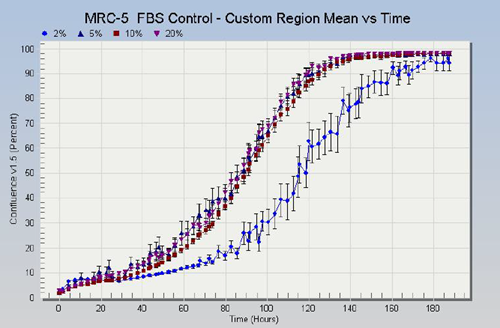
Cell lines to be used for serum screening are counted and seeded at identical numbers into 96 well plates, using at least 12 wells per test serum. The batches for testing are compared with a batch previously tested and retained as the ‘benchmark’ or control serum. Cells are typically prepared in 2%, 5%, 10% and 20% serum. Although 10% is the default concentration for the majority of cell lines, screening at the lower concentrations can indicate whether a particular batch of serum has a higher level of growth factors. Growth curves are generated by calculating the mean cell density for the total number of wells seeded, for each serum concentration and serum batch. Error bars indicate the standard deviation in confluence between the wells scanned.
The results for the human fibroblast MRC-5, one of the lines used for screening at ECACC are shown above. The graph shows growth curves for cells grown in 2%, 5%, 10% and 20% FBS from the same serum lot, in this case the control used for comparison with sera to be screened. When each serum is compared at the four concentrations, there is little difference in growth rate between the three highest concentrations, but by superimposing the growth curves for the same concentrations of the different sera, on the same graph, differences can be seen more easily.
Growth curves produced with other cell lines chosen to provide a range of cell types produced similar results. This allows selection of the serum producing the best overall result with the selected cell lines. Screening in this way guarantees that the most effective batch of FBS is always used to grow ECACC cell lines.