
Interpreting STR Profiles
Interpreting electropherograms
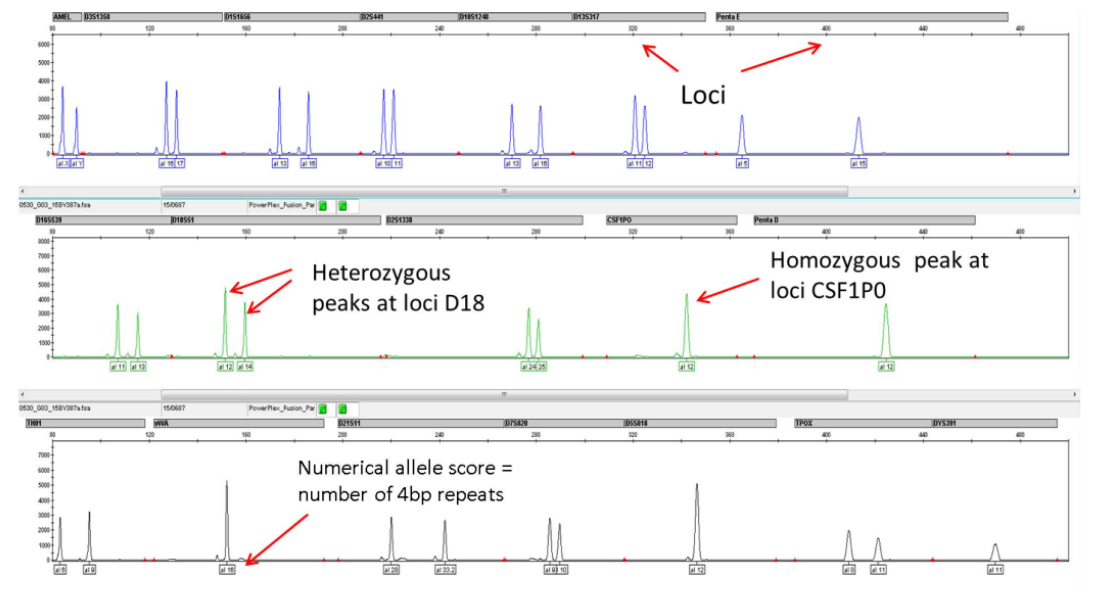
Interpretation of cell line STR profiles - instrumental artefacts
Stutter
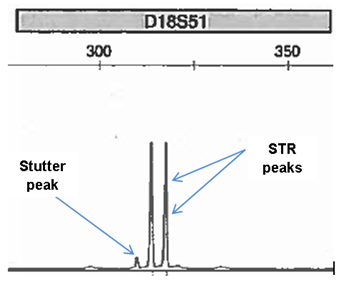
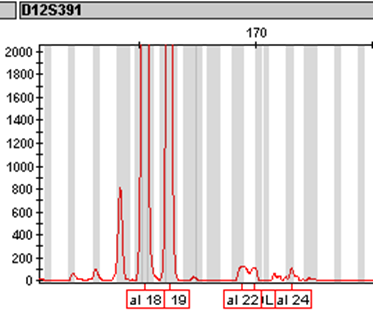
Stutter is the most common instrumental artefact and is caused by DNA slippage during amplification. Stutter occurs in between 6-10% of amplification products1. If there is slippage in the strand which is being copied, then some of the amplified strands are 4bp shorter than the PCR product should be.
This can be seen on the electropherogram as stutter peak.
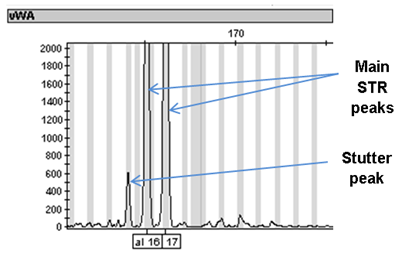
Note that the designation of the stutter product is based on the relative peak heights of the stutter product to the main peak(s) and not on the relative fluorescent units. In the electropherograms below, the stutter product for loci vWA and D12S391 are about 800 RFU but they are still designated as stutter because they are less than 10% of the main peaks.
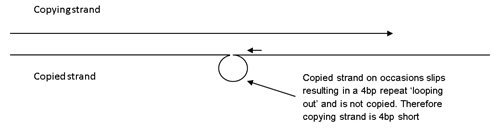
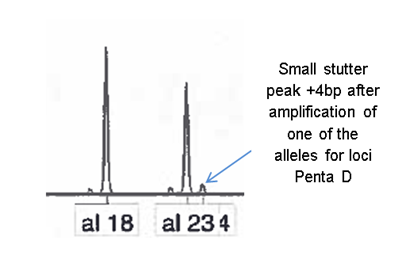
Less frequently, DNA slippage occurs in the copying strand, a 4bp repeat is copied twice in the same strand resulting in a minor peak which is 4bp longer than the main peak(s).
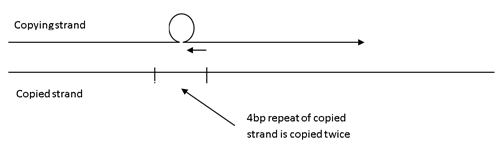
The copying strand slips back 4bp while copying resulting in one repeat being copied twice. A small proportion of amplified products are 4bp longer than the main product.
Incomplete adenylation
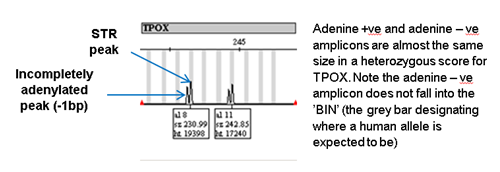
Taq polymerase always ends its amplification run with the addition of an adenine residue. However, if there is too much DNA template then this leads to some of the amplicons not ending with the terminal adenine residue which is therefore 1bp shorter than the main amplicon. This produces a characteristic ‘split peak’ on the electropherogram.
Dye blobs
Dye blobs are peaks caused by the dissociation of the fluorescent tag from the primers as they break down. They are usually wider than STR peaks and can occur anywhere in the analysis and are therefore not associated with an allelic ‘BIN’.
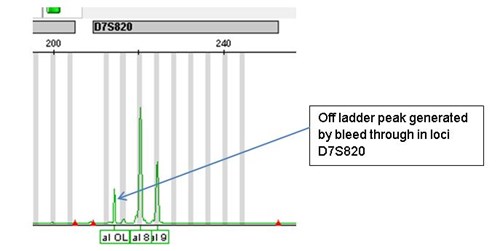
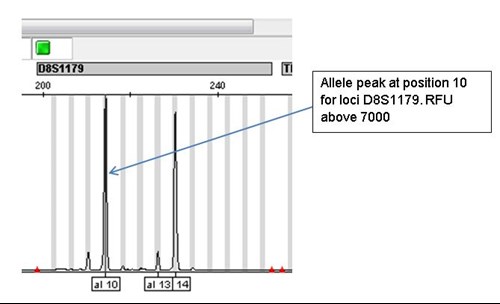
Example of bleed through
The allele peak at position 10 in loci D8S1179 is above 7000 RFUs and has resulted in an off ladder (OL) peak in a different channel for loci D7S820.
Reference
1.Leclair, B. et al., 2004. Systematic analysis of stutter percentages and allele peak height and peak area ratios at heterozygous STR loci for forensic casework and database samples. Journal of forensic sciences, 49(5), pp.968–80.
Interpretation of cell line STR profiles - biological artefacts
Microvariant (off ladder) alleles
As part of the analysis during STR profiling, an allelic ladder must be run at the same time. An allelic ladder is a collection of sized DNA fragments representing all of the known alleles for the different loci used in STR profiling.
These ladders are used to produce ‘BINS’. These are locations where the software locates a particular STR amplified product and converts the size of the DNA fragment for a particular allele into a ‘score’ representing the number of repeats in the STR.
For example a score of 11, 12 for loci ‘TPOX’ indicates that one allele had 11 copies of the repeat motif GAAT and the other allele had 12 copies.
However, occasionally a sample may give an amplified product which does not fall into any of the known ‘BINS’. In population studies this may be because the population has not been DNA fingerprinted before and a new allele is found. Or it may be caused by ‘bleed through’ due to excessive signal strength for a particular peak from another channel.
In cell culture, microvariant alleles may be caused by a mutation in one of the repeat motifs reducing it to a three base pair motif instead of a four base pair motif so the amplified STR product will be one base pair short and fall in between BINS (off ladder). This is particularly true for loci FGA which has a number of microvariant alleles. If a microvariant allele is confirmed by sequencing then a new BIN can be allocated to it and it is no longer ‘off ladder’.
Tri-allelism
Tri-allelism is the result of amplification of three copies of the loci usually caused by duplication of one of the STR sites on one of the chromosomes or by autosomal trisomy. A number of tri-allelic scores have been recorded but any novel instances of tri-allelism would need to be confirmed by sequencing.
Unequal peak heights
In well optimised, in vivo STR profiling, homozygous peaks should be about twice the height as heterozygous peaks as there is twice as much template representing the same sized amplicon.
This is not necessarily the case with more unstable, in vitro cell lines.
Unless sequencing is performed, the reasons for unequal peak heights are conjecture, but could be results of chromosomal duplications and autosomal trisomy. A tri-allelic peak will only show if all three copies of the repeat are heterozygous. If three copies of a repeat are present and two are homozygous but the third heterozygous of the others, then the pattern above might be observed. However, unequal peak heights are usually the result of un-optimised PCR.
Multiple peaks
Sometimes the peak patterns for a loci are difficult to categorise using any of the criteria above. This could be because of some genetic instability of a type not discussed above, or due to cross contamination by another cell line resulting in multiple peaks. It is often difficult to decipher whether a cell line is genetically unstable or cross contaminated.The difficulty arises as often only a few of the loci are displaying multiple peak patterns.
In conversation regarding this with Christopher Korsch he states that it is an issue, but that on balance if only a ‘few’ loci are affected then it is probably genetic instability. If more than a few, it could be cross contamination. How many loci constitute a ‘few’ has not been defied. This is the grey area. It is also worth remembering that in the majority of cases of cross contamination one cell line will eventually dominate/exclude the other, so only a single profile (e.g. HeLa) will be seen.
Below is part of an STR profile of a cell line which might present little difficulties in interpretation (Apart from locus D13?).
Below is a partial profile of another of ECACC’s cell lines MOLT 4. Is it genetically unstable or cross contaminated?
Investigation of these kinds of profiles of genetically unstable cell lines indicate that it is the instability in the genome that causes the multiple peaks and not cross contamination.